
September 17, 2020
How much do you think the average UK employee claims in expenses in their career?
According to a study produced by the Association of Accounting Technicians (AAT), the average UK worker will claim a total of £134,617.84 over the course of their working life, equating to around £3,365 per employee per year.
Given that most companies will have a number of employees claiming expenses, it is important that you have a system of checks and balances to ensure the expenditure is:
- a valid business expense
- is deductible when it can be
- helps you understand that spend, so that you can drive cost saving changes.
Cowry Solutions has partnered with Equisys and, in particular, their Zetadocs Expenses tool to help with these checks and balances.
The tool can help you manage expenditure effectively by ensuring that each item of expenditure is easily captured on a phone, coded automatically, then gets approved ahead of being automatically exported into Dynamics Business Central for reimbursement or reconciliation. It also offers greater insight into that expenditure.
But apart from those checks and balances – and productivity gains – there is a richness in the data which offers real benefits.
Deeper insight

We find that most travel and subsistence expenses end up in a small number of G/L accounts, which makes sense from a Chart of Accounts perspective. But this has the downside of not being able to do any form of decent analysis at a more granular level to spot trends and anomalies.
That’s where the Zetadocs Expenses Reporting feed comes to your aid. It’s far easier to spot a trend on flight spend at the expense level, than at the chart of account level of “Travel”. This would require you to dig into each purchase invoice line coded to Travel, then sift out airfare from trains, taxis, and other modes of travel. Not a fun task and very time consuming if you only rely on G/L accounts.
Reporting feed
Learning a new reporting or analytical tool is never that much fun. All finance teams are already very comfortable using Microsoft Excel for detailed analysis and some are now using Microsoft PowerBI as their business intelligence tool, given its integration with Dynamics Business Central. As Excel and PowerBI are great at consuming external data sources that auto refresh, we decided to create the Zetadocs Expenses Reporting feed.
The Zetadocs Expenses Reporting feed uses the OData standard to present your expense data for use with these popular tools. Once connected to the feed, you can then use the flat expenses table to slice and dice your expense data with your analysis tool of choice.
We’ve made each column in the expense table easy to understand and have also defined each one in the Zetadocs Expenses Help along with details on how to connect.
Reporting template
Included in the Zetadocs Expenses Reporting is a PowerBI template that presents a set of visualisations and standard reports out of the box. We’ve chosen to display what we think are the most useful charts below, which can be drilled through to see further details, right down to the individual expenses.

If you are using Dynamics Business Central Dimensions and have made these available for selection against Zetadocs Expenses, then we’ve provided Department and Area charts for further analysis of your departmental and area (or project) spend. These can all be viewed per month, per financial year or overall spend. If other Business Central Dimensions are more useful, then they can be simply configured in Zetadocs Expenses system settings to be used instead. You can also customise the template using the PowerBI desktop app if needed, then publish it for wider use within the business.
If you’d like to explore Zetadocs Expenses further, get in touch.

Want to know how to optimize Microsoft Dynamics 365 CRM for your business?
Contact Us

Sales Transformation with AI: From Chaos to Clarity

Microsoft Government Community Cloud – GCC Explained
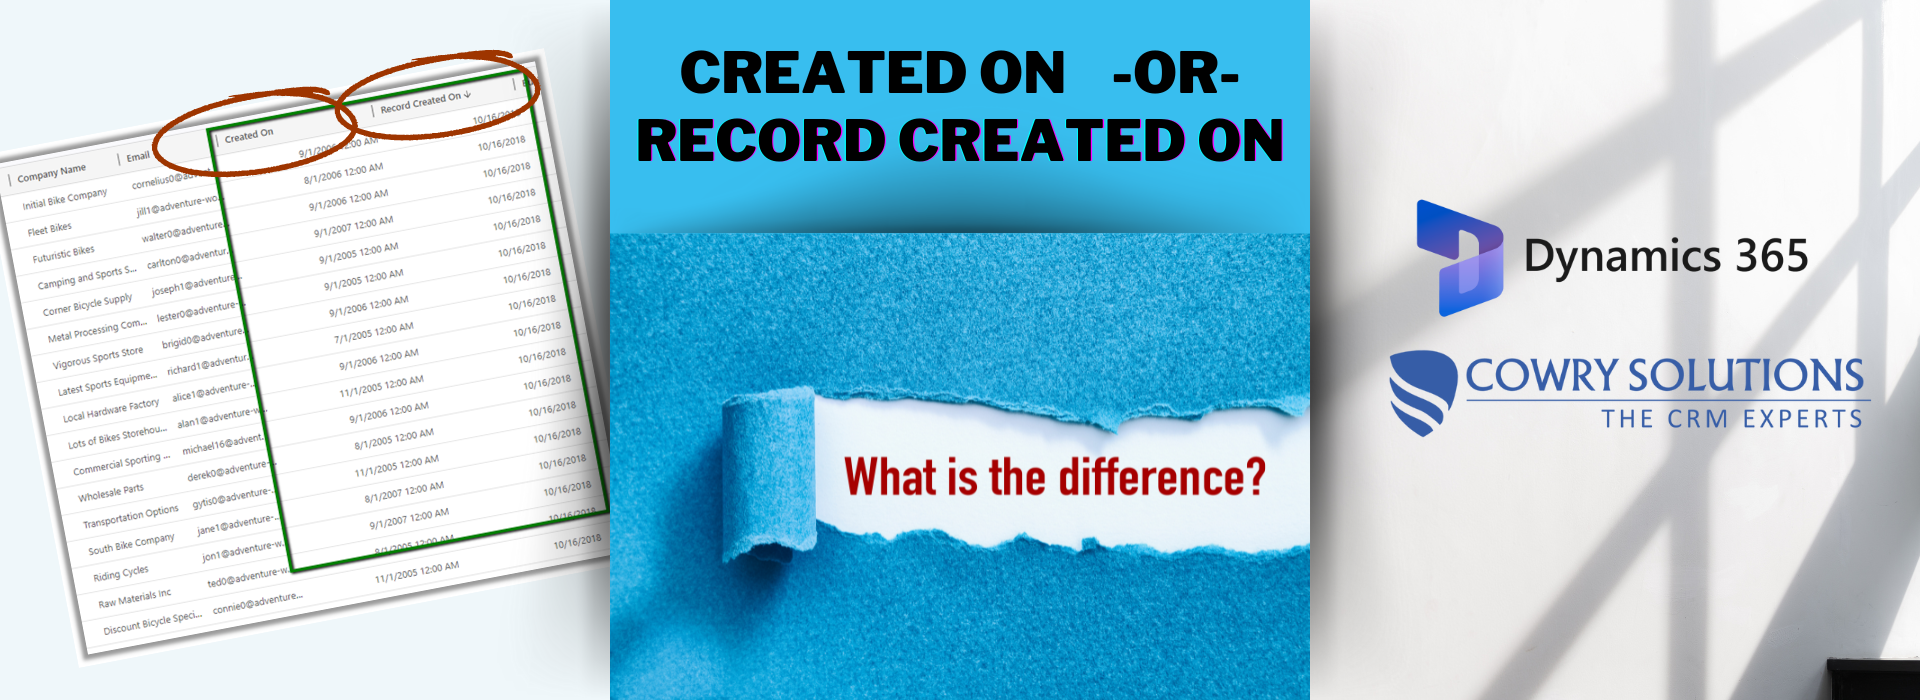
‘Record Created On’ vs ‘Created On’ date fields??
Dynamics CRM Migration from On Premise to the Cloud

Setting up Users in Dynamics 365 Sales

The Sales Process in Dynamics 365 Sales

Top 7 Dynamics 365 Customer Success Strategies

How to Demo Dynamics 365 CRM Sales
Ready to make your CRM work for you?
Contact